




Evidence-based intelligence workflows for active equity traders

Find the setup. See the evidence. Get alerts if thesis is at risk.

Describe an equity setup in plain English. Visual Sectors screens the market, replays the same rules across point-in-time history, turns the strongest current factors into one clear Evidence Brief, and monitors the risks you choose.

  • Speed — move from an idea to a confirmed screen in minutes.
  • Proof — see frequency, sample size, and observed historical outcomes.
  • Continuity — save the screen, thesis, and monitoring conditions.
See a sample workflow
Research and historical analytics only. No execution. Historical results are not a forecast. You make every decision.
Why the workflow?

Save time, reduce uncertainty, cut noise

SPEED

Ask in plain English, review the interpreted rules, and get a focused equity shortlist without rebuilding the research process each time.

PROOF

See how often the setup appeared, how many ideas it normally produced, and what the observed historical outcome distribution looked like under fixed assumptions.

CONTINUITY

Save the Research Lens, screen, thesis, and risk conditions so the workflow can tell you when something meaningful changes.
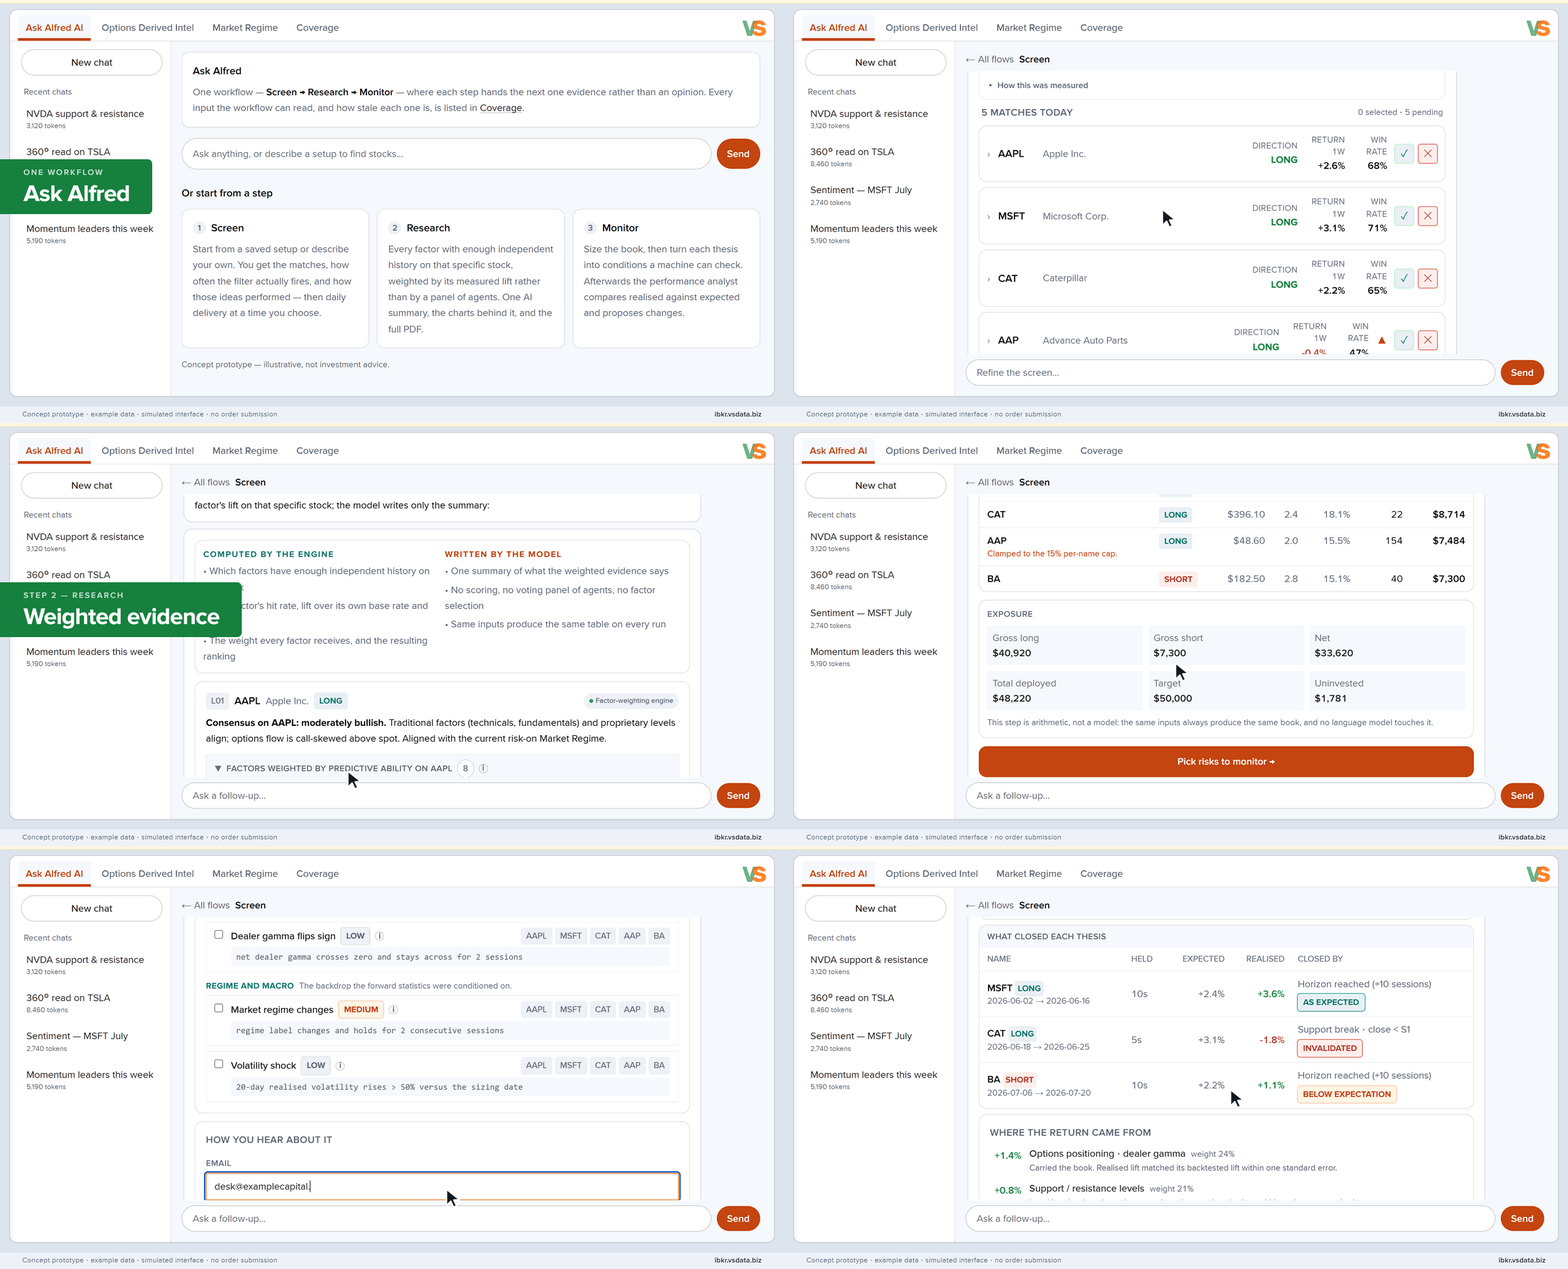
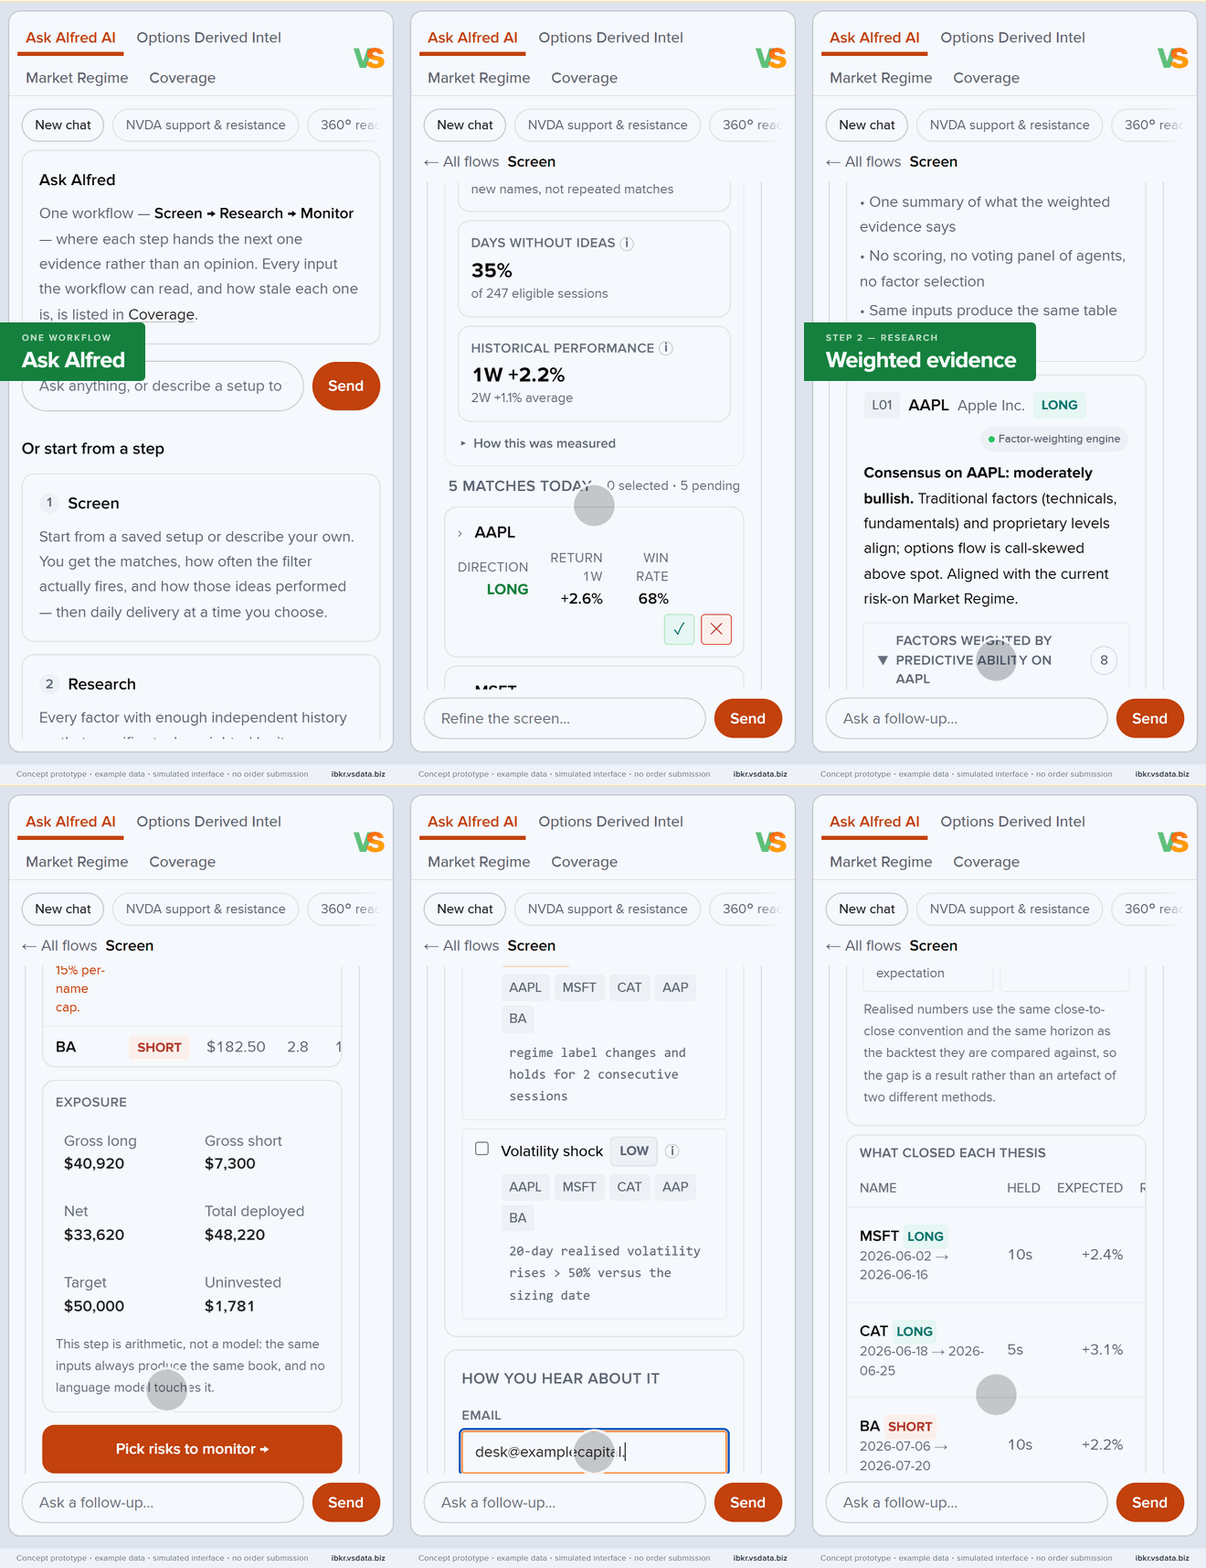
What you get

A customisable trade management workflow using evidence based intelligence

Visual Sectors workflow live demo

3 performance pillars

Exclusive data

Options-derived proprietary indicators and levels.

Robust backtesting

Evidence layer that weighs factors.

Memory & Learning

Constant improvement based on your usage.

Analysts

  • Fundamentals — Looks into financial ratios and earnings.
  • Macro — Looks into macroeconomics, liquidity, and key trends.
  • News and sentiment — Analysis of news and media.
  • Market regime — Proprietary detector using classic and options-based breadth, volatility surfaces, and trend strength.
  • Options indicators — Proprietary analysis of options flows (30 indicators).
  • Support / Resistance levels — 12 methods to identify perfect confluence for entry and exit.
  • Technical analysis — Reads charts.

Decision Support

  • Watchlist composition — Screens a universe of 7,000 stocks to find names most aligned with your thesis.
  • Trade planner — Defines specific entry, exit, target points, and position size.
  • Risk manager — Defines risk of each position in isolation and as part of the portfolio.
  • Portfolio manager — Suggests a short list of positions and allocation size.
  • Detailed report builder — Returns all known information about a stock in a clear and actionable way. Sends a PDF to your email.

Performance Support

  • Journaling agent — Keeps track of trades.
  • Monitoring agent — Performs automated checks of price changes and news.
  • Performance analyst — Suggests improvements to your thesis.
The problem

Most tools stop one step too early.

SCREENERS

They tell you what matches now, not whether the setup was common, rare, or historically useful.

AI RESEARCH

It can produce fluent explanations, but not a defensible hierarchy of factors grounded in observed evidence.

ALERTS

They track price and headlines, but usually forget why the idea mattered in the first place.

RESOLUTION

Visual Sectors adds history to discovery, evidence to research, and continuity to monitoring.

How it works

One connected process from idea to ongoing evidence.

The intelligence is complex. The customer experience is three steps.

  1. A · History

    SCREEN

    Find setups, confirm the rules, and see their historical footprint.

  2. B · Evidence weights

    RESEARCH

    Turn the strongest supporting and contradictory factors into one Evidence Brief.

  3. C · Continuity

    MONITOR

    Choose the risks that matter and receive alerts only when the saved setup changes.
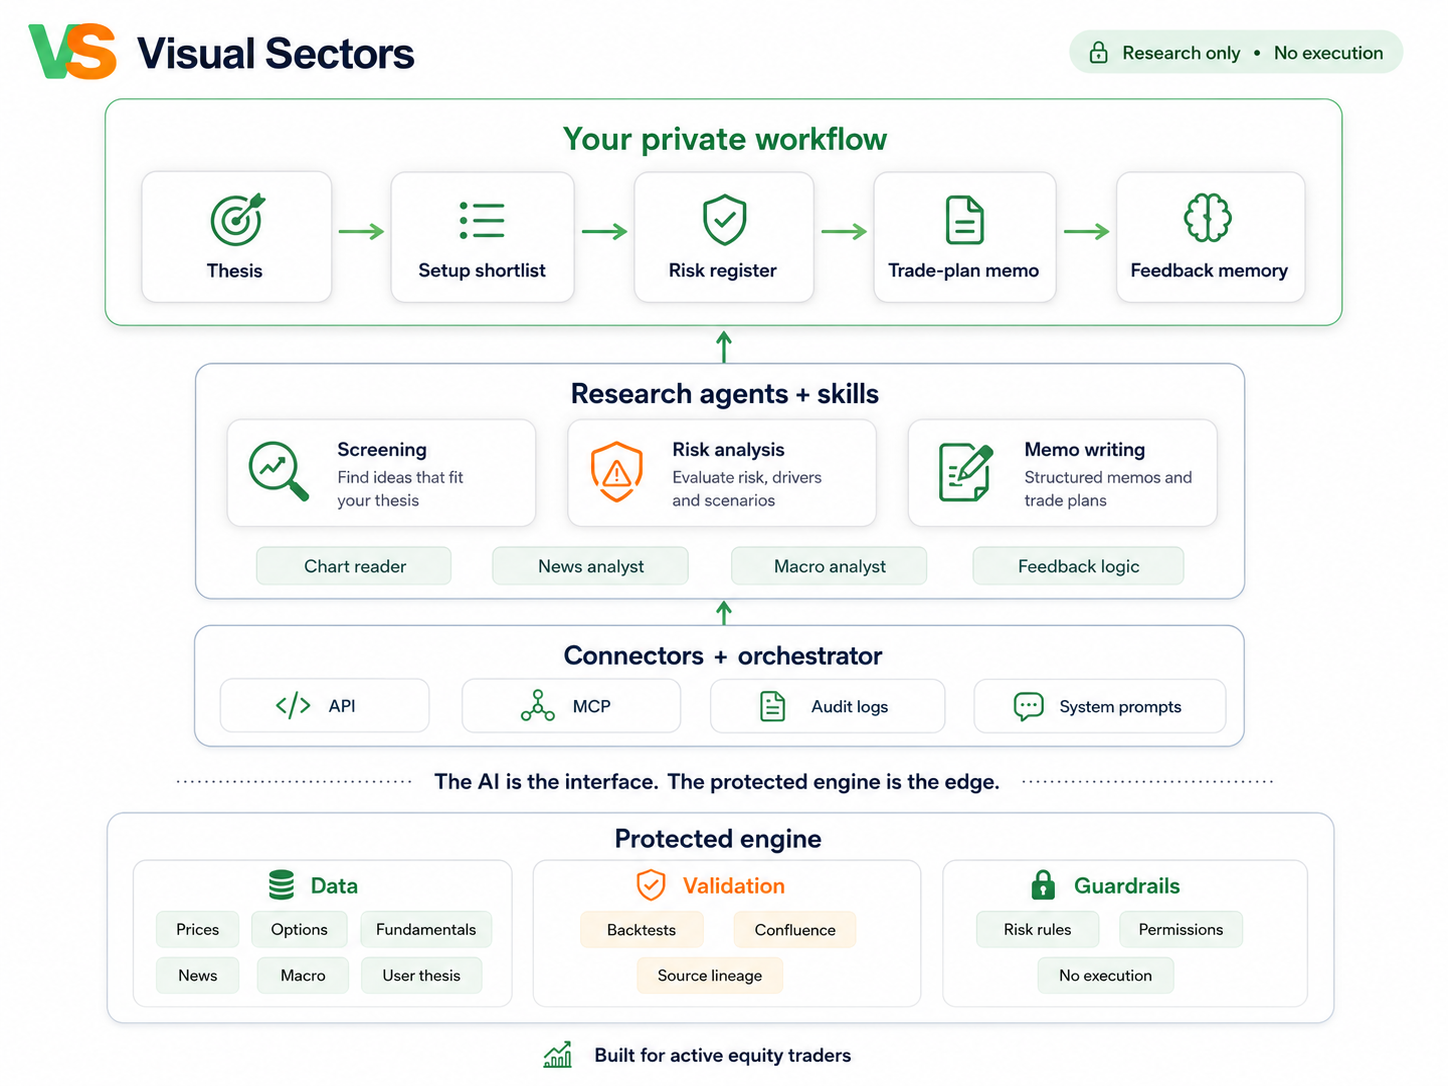
The architecture

The AI is the interface. The protected engine is the edge.

Private workflow
powered by
Protected engine: Data · Agents · Guardrails

Data

  • CBOE options data
  • Fundamental, Macro, News, Earnings, Social media datasets
  • 12 groups of Support/Resistance levels with backtests
  • 30 proprietary options-derived indicators
  • 50+ classic technical indicators

Agents

  • 7 Research Analyst agents
  • Portfolio Manager
  • Screening, watchlists and idea generation Manager
  • Market and asset regime Analyst
  • Trade planner
  • Customisable and editable prompt extensions

Guardrails

  • Risk manager
  • Journaling and performance analysis agent
  • Monitoring agent
Visual Sectors architecture: private workflow, research agents, connectors, and protected engine
Why trust us

Built by quants. Proven in live markets. Used by real traders.

A. Team of quants and industry veterans

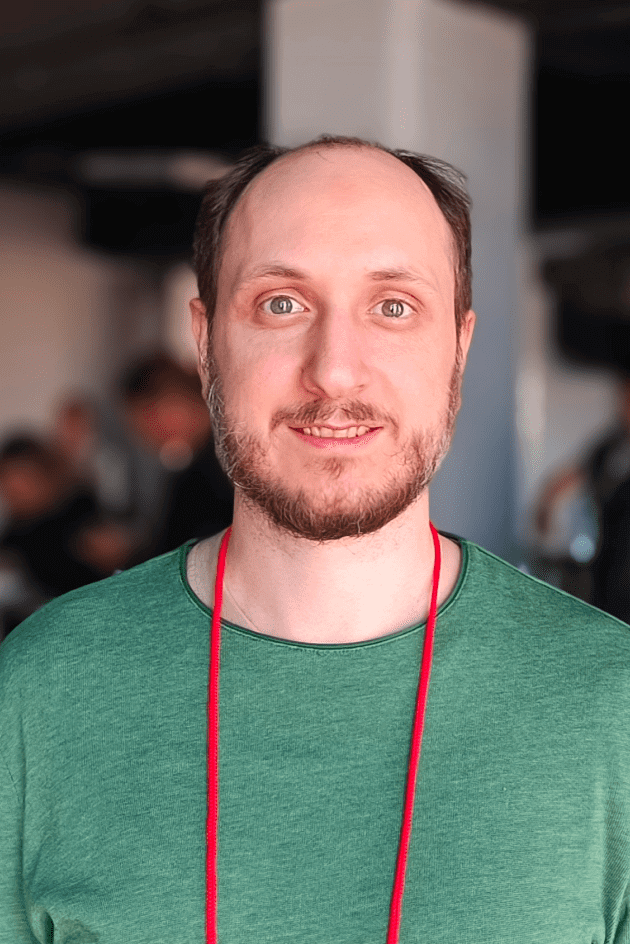
Brian Tancock, CFA
Chief Analyst

Brian Tancock, CFA

ex-BlackRock · 20+ yrs Wall Street

LinkedIn

B. Live track record

Market-Neutral Strategy

Live for 13 months. +35.92% vs SPY +8.58%.

Publicly tracked since 24 Feb 2025. $10,000 in the EMN strategy vs SPY — higher Sharpe, lower drawdown, higher win rate, lower VaR.
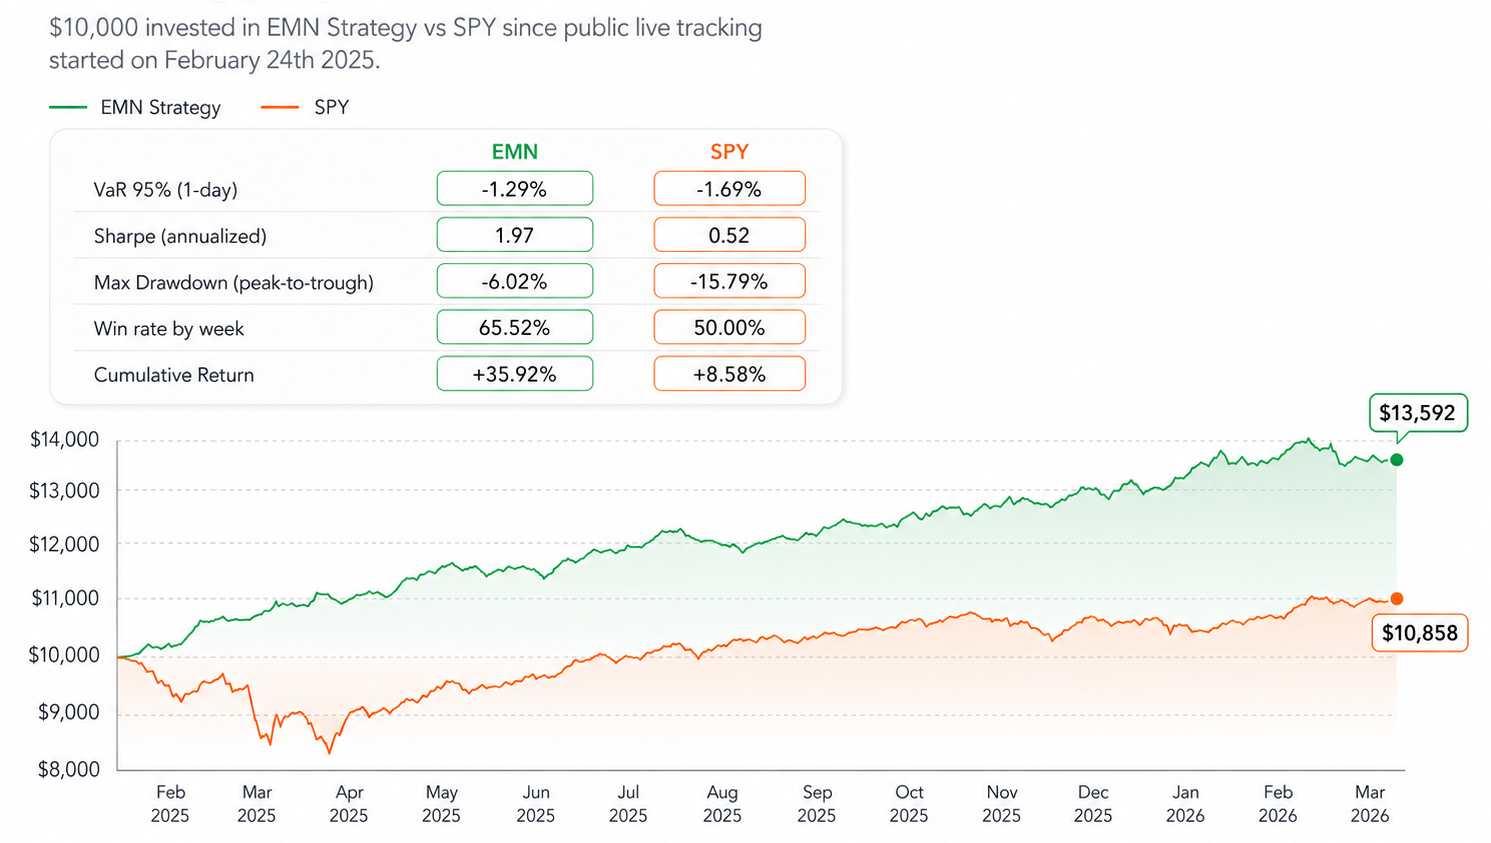
EMN strategy vs SPY since 24 Feb 2025: +35.92% vs +8.58%, Sharpe 1.97 vs 0.52, Max DD -6.02% vs -15.79%, Win rate 65.52% vs 50.00%, VaR 95% -1.29% vs -1.69%

C. 4 years of high-end engineering in search of alpha

30

Proprietary options-derived indicators

3

Machine-learning models in production

750k+

Backtests performed

D. Customers reporting up to 10% a month

Started with a $4,000 account and inconsistent results. The first 15% month became my a-ha moment — Visual Sectors data has helped me return more than 30% in 2025 so far.

Luke
Up to 15% in 30 days

Ten success stories of Visual Sectors users — how the product evolved to help traders get better, more consistent results, and exactly how it made money for our customers.

Case study overview
3 ways users turned data into profit

I didn't have a lot of trading experience when I attended the Market-Neutral workshop. A couple of weeks later I was able to lock in profit just following a simple 3-step process.

Kyle
Profitable from a standing start

Visual Sectors models deliver strong returns on multiple occasions, and the risk profile of the strategies allows trading stocks with a valid mathematical expectation of positive returns.

Model validation
Prof. Ali Dadpay, PhD Econometrics

Each statement is one person's experience. Individual results vary and do not guarantee future returns. Identity and consent verified for all testimonials.

Sample memo

A clearer memo before you make the call

Download a real Visual Sectors trade-plan memo and see how thesis, evidence, levels, and risks come together.
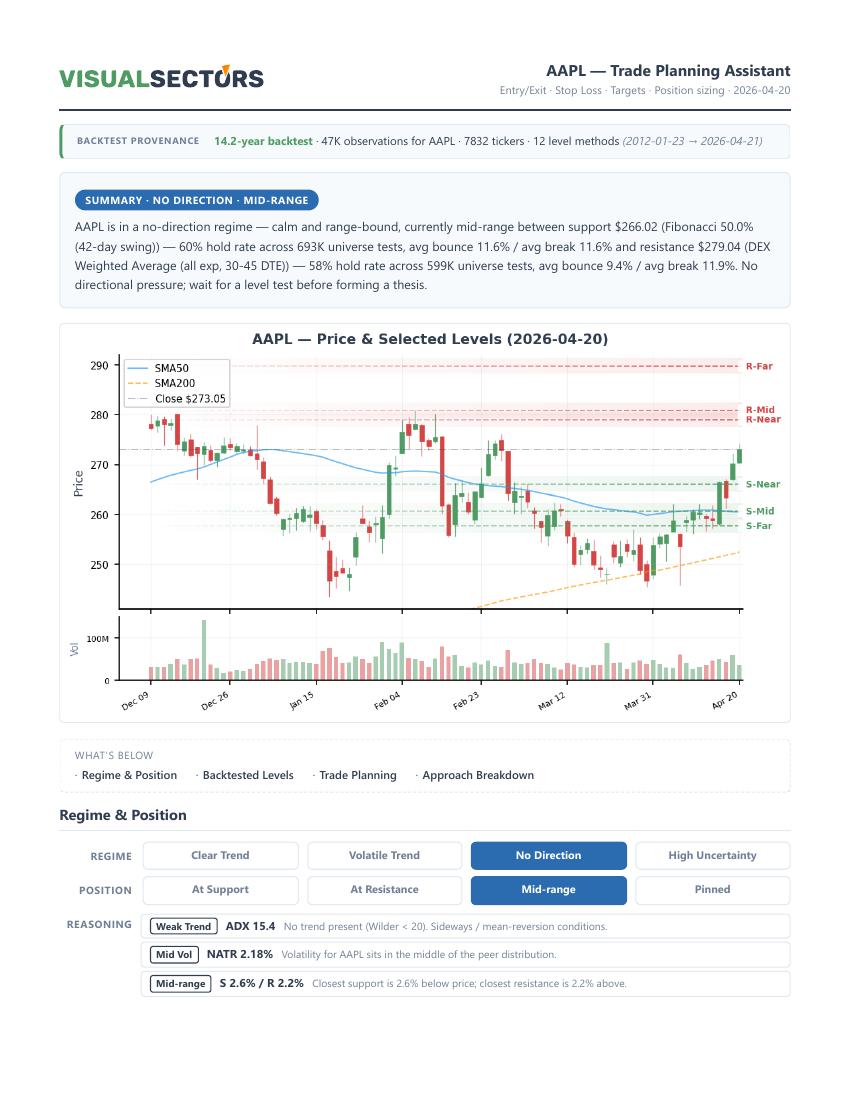
AAPL trade-plan memo preview
AAPL · 2026-04-20 PDF

AAPL — Levels & trade plan

A real example of a Visual Sectors memo: thesis, supporting evidence, key levels, confluence, and explicit risks. Use it as a benchmark for what your private workflow can produce.

Comparison

Not a chatbot. Not a screener. Not a trading bot.

Versus ChatGPT / Claude

Generic AI can summarize and brainstorm. Visual Sectors adds data, workflow memory, indicators, validation context, and guardrails.

Versus TradingView

TradingView is great for charts and alerts. Visual Sectors turns chart context, data, news, risk, and thesis fit into a research memo.

Versus screeners

Screeners return lists. Visual Sectors filters, explains, validates, and prepares the next research step.

Versus hiring a quant

A quant stack is expensive and slow to build. Visual Sectors wraps data, agents, and guardrails into a workflow a trader can use.

Research discipline

Built for research discipline, not blind automation

  • No broker execution in the pilot.
  • No guaranteed returns.
  • No black-box buy/sell commands.
  • Calculations and data processing should be deterministic where possible.
  • Agent outputs are labeled as research support, not final truth.
  • Backtests and historical context are shown with assumptions and limitations.
  • Risk flags are surfaced before the trader decides.
Starter workflows

Three workflows to start with

Workflow 1

Watchlist scan

"Scan my equity watchlist and show which names deserve deeper review."

Workflow 2

Thesis to trade plan

"Turn this market thesis into a structured memo with evidence, risks, and monitoring logic."

Workflow 3

Volatility and risk review

"Tell me what could go wrong before I spend more time on this setup."

Founding Trader Pilot

Apply for a Founding Trader Workflow

Included

  • Strategy-mapping call
  • Workflow specification
  • Custom research workflow setup
  • First watchlist scan
  • Sample trade-plan memo
  • Risk-register format
  • Two workflow iterations
  • Feedback loop

Best suited for

  • Active equity traders
  • Swing traders
  • Prosumer investors
  • Busy professionals with capital and limited research time
  • Traders who already have a process or thesis

Not suited for

  • Day traders looking for instant alerts
  • Beginners wanting exact buy/sell instructions
  • Users looking for autonomous execution
  • Options-first traders, unless that becomes a later workflow
  • Anyone expecting guaranteed returns
Apply for the Pilot

Research assistance only. You make every final call.